Writing a Declarative Jenkinsfile for Angular Applications
- Posted by Yomna Anwar
- On August 15, 2021
In the previous article, we discussed the details of a declarative Jenkins pipeline built for a java application. now that we know what CI/CD is and how can we use Jenkins to achieve our automation goals. In this article, we will discuss how can we apply the same concepts for an angular application to automate its build, test and deployment tasks.
Jenkins file break down
The Jenkins file that we’re going to write is very similar to the one we wrote before. Let’s highlight the differences.
Tools
we’re going to use NodeJS to be able to make Jenkins perform tasks like building the angular app. (Make sure that NodeJS plugin is installed for Jenkins. This plugin can be installed from this link https://plugins.jenkins.io/nodejs/ )
tools { nodejs "NodeJS" }
THE CLICK IN BODYBUILDING, no longer seeing training as a chore Fitnessmith smith machine vs free weights auvergne sport détente (asd) (weight / cardio training room), clermont-ferrand (63100) – puy-de-dôme.
Stages
In our pipeline, we’re going to perform the following tasks (build the app, test the app, containerize it, and finally deploy it to K8S) so let’s see part of the file associated with each step.
Build and Test stage
This stage is very simple and straight forward. We Will use NPM (bundled with NodeJs module that we installed earlier) to perform both build and test on our app We can rely on a custom-defined parameter to decide whether we’re going to skip the tests or not. the associated Jenkins file stage should look like this.
 stage('Build') {
        steps {
           script{
             if(params.SKIP_TESTS){
               sh 'npm install'
               sh 'npm run build:${ENV}'
             }else{
               sh 'npm install'
               sh 'npm run test'
               sh 'npm run build:${ENV}'
                    }
                  }
               }
             }
SonarQube stage
Code coverage is one important metric that can help you understand how much of your code is covered in tests. It is one of the metrics that should be taken into consideration when assessing your overall code quality.
There are a simple set of steps required to integrate the tests you have written in your Jenkins job. In this example, we are using a decelerative pipeline with a Jenkins file in the root directory of our angular application.
1. Your tests can run in a UIless browser. modify your karma.conf.js file and add the following lines to make it run in a UIless mode
customLaunchers: {

    ChromeHeadless: {

        base: 'Chrome',

        flags: [

           '--headless',

           '--disable-gpu',

           '--no-sandbox',

           '--remote-debugging-port=9222',

         ]

      }

},

browsers: ['ChromeHeadless'],

singleRun: true,

restartOnFileChange: true
2. In your package.json file, configure the following task
"test": "ng test --watch=false --code-coverage"
3. In your Jenkins file, in the build step invoke this task.
Integrating SonarQube with Jenkins pipeline
Wouldn’t it be great if you can assess your angular project quality at any point in time? Especially if you are applying micro frontend architecture in your project. it will be very tedious and time-consuming to generate a code coverage report. You will have to go through all your micro frontends and run the code coverage command then gather all the output reports in one report manually to hand it to the architect or the team lead.
That is when SonarQube comes into play. Sonar enables you to monitor and assess your project’s quality easily with a simple and user-friendly interface.
The proposed solution here is to integrate your Jenkins pipeline with sonar so whenever you trigger a deployment, a code coverage report and test execution report should be generated and given to sonar. Sonar then displays these reports in a user-friendly manner along with static code analysis details.
We will assume that you already have SonarQube Installed. And here are the solution steps
Solution steps
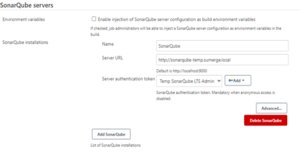
1. Connect your Jenkins with SonarQube. This is done by going to ‘Manage Jenkins -> Configure System -> SonarQube Server’ then add the details of your SonarQube server

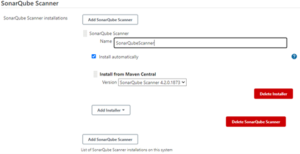
2. To run project analysis with Jenkins a scanner plugin must be installed. This is done by going to ‘Manage Jenkins -> Global Tool Configuration -> SonarQube Scanner ’

3. Next step is to install two plugins in our angular application that will generate the test coverage report and the test execution report. This is done by executing the following commands
npm install karma-coverage-istanbul-reporter

npm install karma-sonarqube-unit-reporter
4. The second step is to configure these plugins to generate the reports we want. This is done by adding these changes to your karma.conf.js file
 plugins: [

require ( karma-coverage-istanbul-reporter"),

require ( korma-sonarqube-unit-reporter')

],

coveragelstanbul Reporter: {

dir: require( 'path').join(_dirname, 'coverage),

reports: [ 'lcovonly').

fixWebpackSourcePaths: true

},

reporters: [ 'sonarqubeUnit' ],

sonarQubeUnitReporter: {

     sonarQubeVersion: 'LATEST',

     outputfile: 'test-reports/ut_repor.xml',

     overrideTestDescription: true,

     testPaths: [./src'],

     testFilePattern: .spec.ts',

     useBrowserName: false

},
5. The final step is to configure our Jenkins Job using the declarative pipeline file to use the generated reports and provide some information for SonarQube regarding where the tests files are, what to scan and what not to scan, etc. and this is done by adding a sonar stage in our pipeline like the following
stage ( 'SonarQube analysis') {
    environment {

        scannerhome= tool 'SonarQubeScanner'

   }

   steps {

      withSonarQubeEnv( 'SonarQube) {
          sh ' '' '
          ${scannerHome/bin/sonar-scanner\
          -D sonar .projectKey-creation-bo-ui \
          -D sonar .projectName-creation-bo-ui \
          -D sonar.sources= src \
          -D sonar.tests= src\
          -D sonar.typescript.tsconfigPath=tsconfig.json \
          -D sonar.exclusions-node_modules/** \
          -D sonar.test. inclusions= **/* .spec.ts \
          -D sonar, testExecut lonReportPaths-test-reports/ut_report.xml\
           -D sonar.javascript.lcov.reportPaths-coverage/lcov.info
           ' ' '

         }

    }

 }
Let us explain the above stage in detail.
The first thing we are doing here is defining the location of our scanner that we installed in step 2. You only need to provide the scanner name.
In the steps, we are pointing here at SonarQube server that we configured in step 1.
Then we‘re passing some information to sonar server. About our files locations and where our tests are and where can sonar find the execution report and the coverage report.
Docker stage
After we are done with building and testing our app. Time to create a docker image which we can then deploy onto Kubernetes dynamically using the docker registry and Kubernetes namespaces declared in the parameters.
stage('Docker') {
   stages {
      stage('Create Image') {
         steps {
             script {
                 sh 'sed -i "s|@DOCKER_REGISTRY@|${DOCKER_REGISTRY}|g" Dockerfile'
                 dockerImage = docker.build registry + "offices-reports-ui:$BUILD_NUMBER"
             }
          }
       }
       stage('Push Image') {
          steps {
             script {
                 docker.withRegistry('') {
                     dockerImage.push()
                     }
              }
          }
        }
     }
  }
K8s Deploy
The final stage is to deploy the generated docker image into k8s cluster using the below commands.
 stage('K8s deploy') {
    steps {
        sh """
sed -i "s|@BUILD_NUMBER@|${BUILD_NUMBER}|g" $WORKSPACE/kubernetes.yml
sed -i "s|@HOST@|${HOST}|g" $WORKSPACE/kubernetes.yml
sed -i "s|@DOCKER_REGISTRY@|${DOCKER_REGISTRY}|g" $WORKSPACE/kubernetes.yml
sed -i "s|@NAMESPACE@|${NAMESPACE}|g" $WORKSPACE/kubernetes.yml
kubectl apply -f $WORKSPACE/kubernetes.yml -n ${NAMESPACE} --kubeconfig /var/jenkins_home/k8s/${NAMESPACE}
"""
     }
   }


